The Dynamic Duo for Data Analysis and Visualization
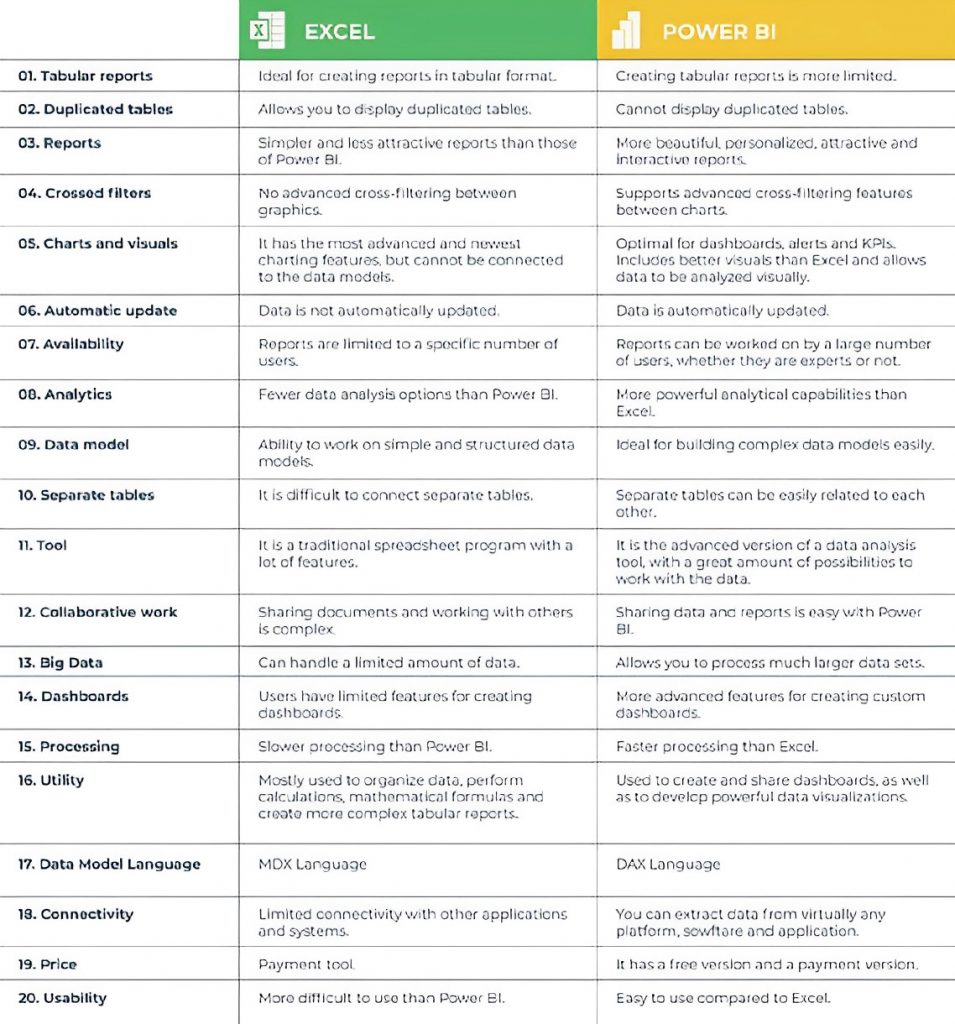
Both Excel and Power BI are products from Microsoft. However, while Excel is a tried-and-true tool that's been around for decades, Power BI is a newer addition to the Microsoft suite, quickly gaining popularity.
Despite their differences in capabilities, both tools share a common goal - to help users process and analyze data in an effective and user-friendly way.
EXCEL
VS
Power BI
NOW
RM2399
PL-300 Design and manage analytics solutions using Power BI (Formerly Known as Power BI Analyst)
Transform Your Data Skills with PL-300 Training at RM2399 and Receive a FREE Exam Worth RM450
With Power Query, you will learn how to clean, shape and merge data from various sources into a single dataset, while Power Pivot allows you to build relationships and create calculations using that data.
Location easy to find.
Parking bit pricy at mall.
Very clean and welcoming environment.
Friendly and helpful staff.
Seamless support bu Azura and her team (Ayda & Syabil) i had worry free process from the registration to the exam. Excelent Service.
Good facilities & staff. Trainer is good & full of knowledge
Very good course and informative with a lot of knowledge sharing
Posted on
Felicia Tan
18 March 2026
Trustindex verifies that the original source of the review is Google.
Very nice place for training, good facilities, good learning environment
Posted on
Han Eul
18 March 2026
Trustindex verifies that the original source of the review is Google.
Environment is comfortable and conducive for learning
Posted on
Muhammad Adiv Aiman
17 March 2026
Trustindex verifies that the original source of the review is Google.
Facilities is Good, amenities is good also
Posted on
Eunice Ma
13 March 2026
Trustindex verifies that the original source of the review is Google.
Nice and comfortable place . Food is good and staff is friendly.
Posted on
YY
13 March 2026
Trustindex verifies that the original source of the review is Google.
Efficient training. Superb
Verified by Trustindex
Trustindex verified badge is the Universal Symbol of Trust. Only the greatest companies can get the verified badge who has a review score above 4.5, based on customer reviews over the past 12 months. Read more
Why Enrol Training Course at Info Trek?
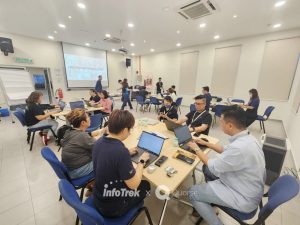
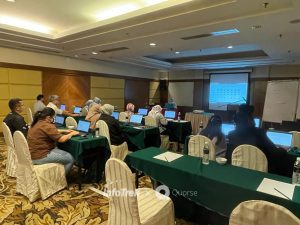
Info Trek's Training Centre
We provide 25 training rooms with the span of 2 locations which are Petaling Jaya and Penang. We aim to fulfil customers’ training
FAQs
Need help?
Send us a message
Ready to take the first step toward reaching your goals?
Fill out the form now and start your journey toward success.