The Dynamic Duo for Data Analysis and Visualization
Both Excel and Power BI are products from Microsoft. However, while Excel is a tried-and-true tool that's been around for decades, Power BI is a newer addition to the Microsoft suite, quickly gaining popularity.
Despite their differences in capabilities, both tools share a common goal - to help users process and analyze data in an effective and user-friendly way.
Discovering the Common Ground of Excel and Power BI
Both have robust VISUALIZATION CAPABILITIES, including chart and graph creation, dashboard creation, and other interactive
visualizations.
Both offer a range of INTEGRATION with other Microsoft and third-party tools.
Each new version of both tools is UPDATED REGULARLY with new
features and improvements, expanding the possibilities available to users.
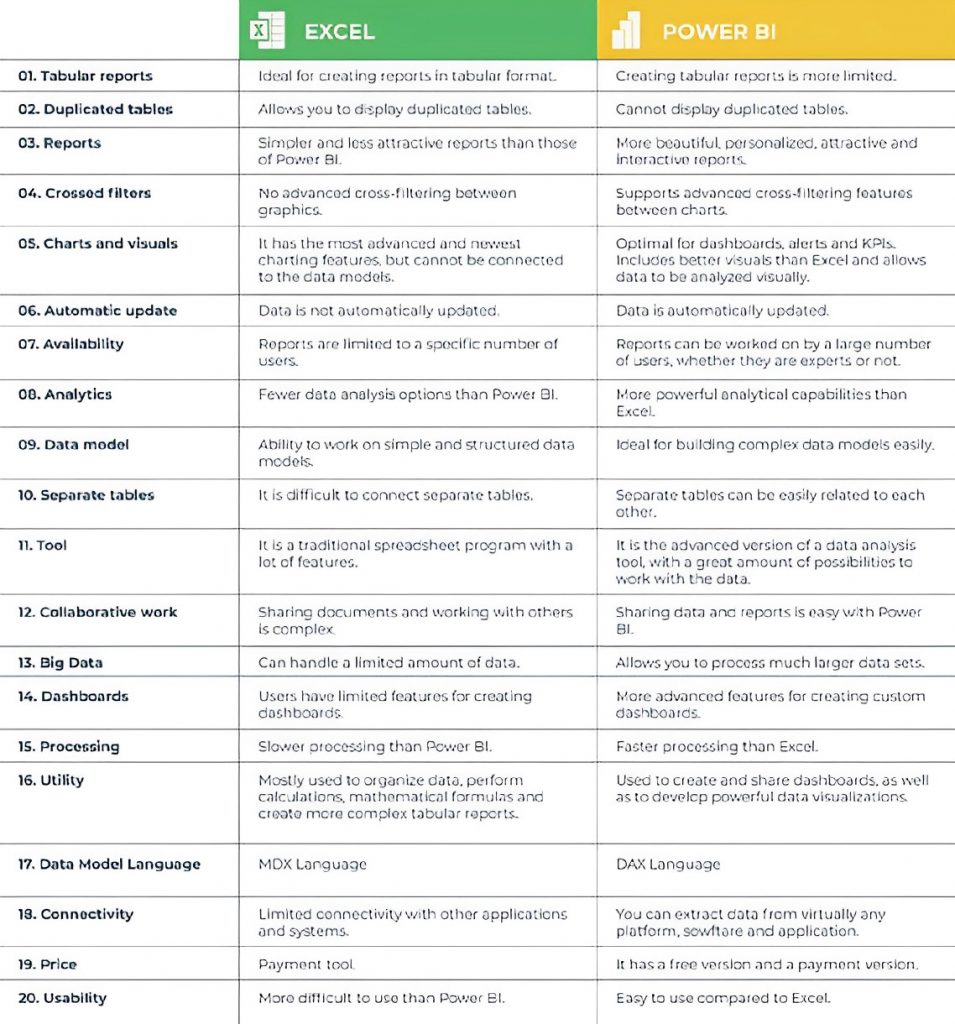
A Comprehensive Comparison of Two Leading Data Analysis Tools
Excel
A spreadsheet tool, which is part of Office 365 and was released in 1985, is a program known by virtually everyone.
Offers extensive or customizable formatting and calculation options.
More suited for smaller data sets.
Commonly used in individual and small business settings.
Limited data source connectivity options.
Generally considered easier to learn and use.
VS
Power BI
A set of tools, software services and business intelligence. applications oriented to business.
Provides more advanced data modeling and analysis capabilities.
Designed for handling larger and more complex datasets.
Commonly used in larger organizations with complex data needs.
Allows for easier integration with other Microsoft tools like SharePoint and Teams.
Requires more specialized knowledge and training to use effectively.
With Power Query, you will learn how to clean, shape and merge data from various sources into a single dataset, while Power Pivot allows you to build relationships and create calculations using that data.